In the realm of higher education, data-driven decision-making is no longer a luxury—it’s a necessity. For technology administrators, instructors, registrars, advisors, deans, and more, having immediate, clear access to actionable data is critical in driving both strategic initiatives and daily operations. Frankly, the value of data lies not just in its accuracy but in how effectively it can be accessed, interpreted, and utilized. This is why we’re thrilled to introduce the latest design enhancements to our My Datasets and Library views within IntelliBoard, crafted to elevate the user experience and empower our clients to do more with your data.

Listening to Our Users: A Design Driven by Feedback
Our commitment to continuous improvement is rooted in our engagement with our users. Over the past year, we’ve gathered extensive feedback from higher education professionals who rely on IntelliBoard to inform their decisions. The message was clear: while our platform’s functionality was strong, there were opportunities to enhance usability, improve accessibility, and streamline navigation.
In response, we’ve made substantial updates that reflect those needs and incorporated client suggestions. This redesign isn’t just a facelift; it’s a comprehensive upgrade aimed at making the data experience more efficient and more intuitive, all while ensuring compliance with critical accessibility standards.
What’s New? Key Enhancements to Elevate Workflow
1. Improved Visualizations & Descriptions
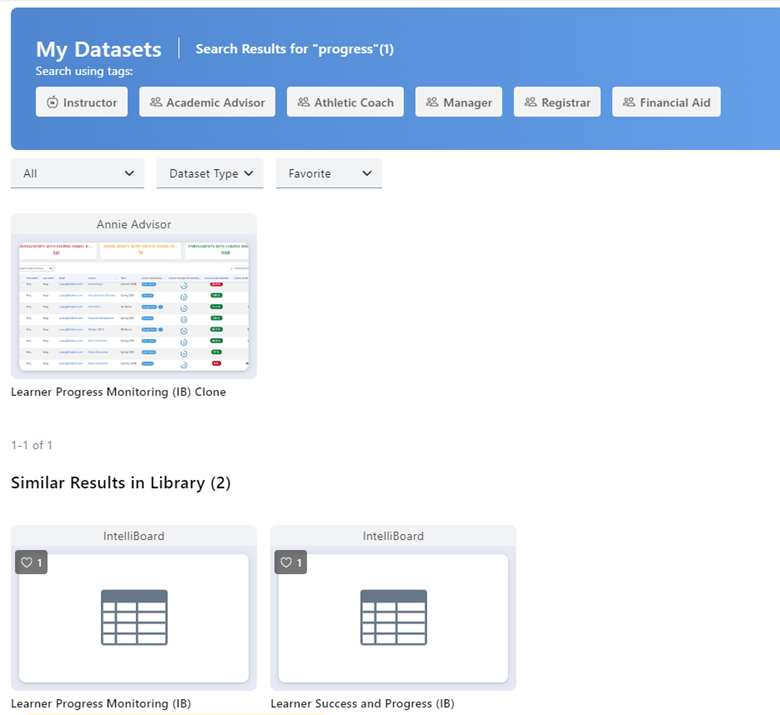
We’ve refreshed the visual design within My Datasets and Library and enhanced the tiles and descriptions to make it easier for our clients to identify and access the reports and dashboards they need. With more detailed descriptions and visually distinct tiles, users can quickly locate the specific datasets that are most relevant to their roles and responsibilities within the institutions. This improvement reduces the time spent searching for data, allowing users to focus on analysis and application. Moreover, clients may also add their own images aligning with their branding and visual comforts.
2. Enhanced Filtering and Search Capabilities
We know that one size doesn’t fit all when it comes to data. That’s why we’ve introduced more robust filtering options, combining datasets and improving filters based on the feedback we’ve received. Whether looking for specific names or dataset types, our new filtering tools help users zero in on the information that matters most.
Additionally, the updated search functionality now spans both My Datasets and Library to ensure users have comprehensive results at their fingertips. This unified search approach not only saves time but also ensures that no critical data is overlooked.

3. Robust List View Functionality
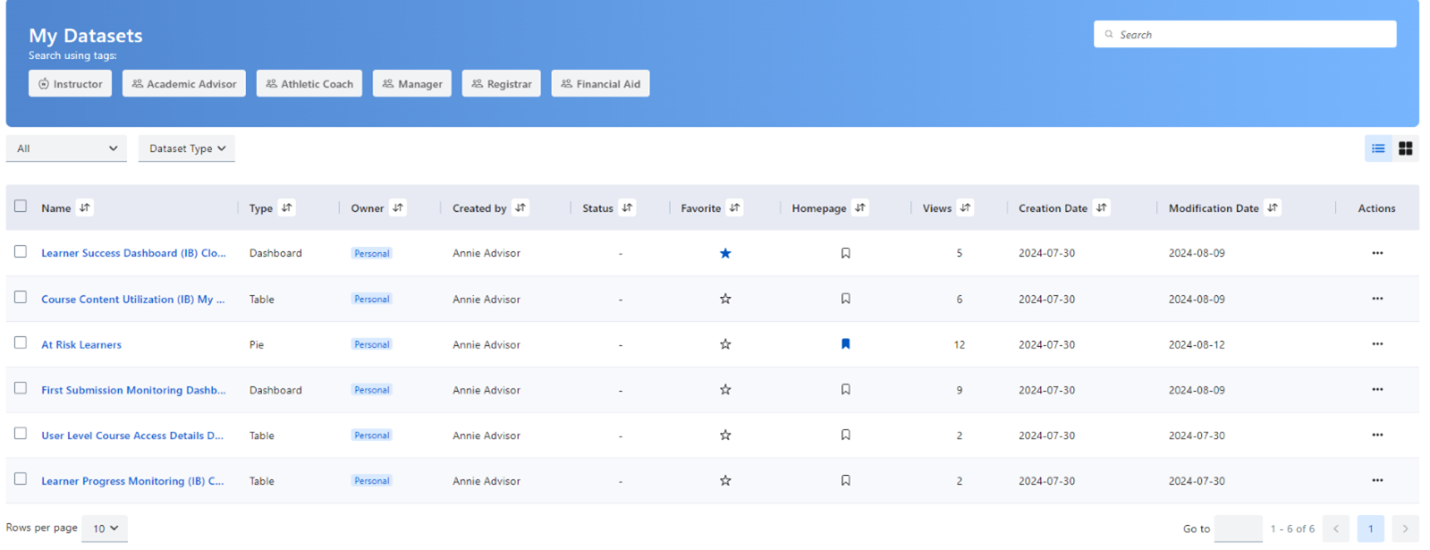
For those who prefer a more detailed view, our List View has received a significant upgrade. Users can now view more robust data directly from the List View, providing a richer and more detailed understanding of their datasets without needing to navigate away from the primary view. This enhancement is particularly useful for administrators who manage large volumes of data and need quick access to detailed insights. Note the last modified dates, quickly highlighting datasets that are used term over term.

4. ADA and Accessibility Compliance
Accessibility is more than a requirement—it’s a priority. We’ve worked diligently to ensure that the new design is fully compliant with ADA standards. These changes include improved color contrasts, keyboard navigation, and screen reader compatibility, making IntelliBoard more accessible to all users, including those with disabilities. By prioritizing accessibility, we ensure that every team member can effectively engage with and benefit from the data IntelliBoard provides.
5. In-Platform Guidance and Updated Tags
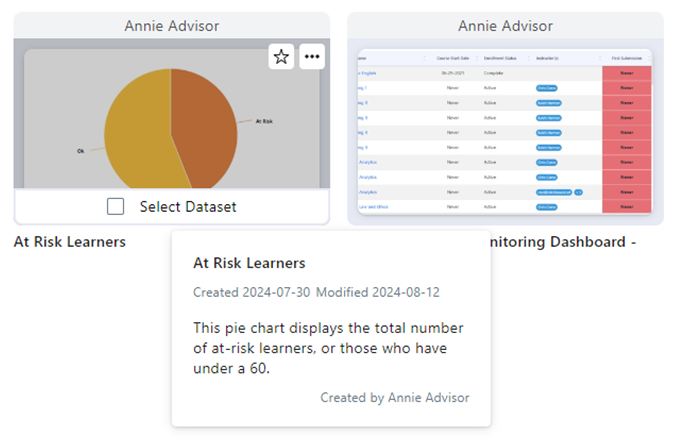
Navigating complex datasets can be daunting, especially for new users or those with varying levels of technical expertise. That’s why we’ve embedded in-platform guidance, including hover features, tooltips, and step-by-step instructions, to help users maximize IntelliBoard’s capabilities. These tools are designed to be intuitive, reducing the learning curve and helping users of all experience levels become proficient more quickly.
We’ve also updated our tagging system to better reflect the specific users who will benefit from each dataset or dashboard. This targeted tagging not only helps in organizing institutional data but also ensures that the right information reaches the right people.

Looking Ahead: Continuous Improvement and User-Centered Design
The redesign marks an exciting step forward, but it’s just one part of our ongoing journey to enhance the IntelliBoard platform. We’re committed to building tools that not only meet but exceed our clients’ expectations, enabling them to harness the full potential of your data in driving educational success.
Want to experience the new design? Schedule a 30-minute call with a Learning Analytics Expert

Elizabeth Dalton measures and improves educational tools, processes, and results by using her experience in instruction and assessment design, development, documentation, and delivery, combined with her knowledge and expertise in technology and statistical methods.
Resources
Explore Learning Analytics Insights
Getting Ready for a New Term: How Community Colleges Use IntelliBoard to Prepare for Success
As the start of a new academic term approaches, many community colleges begin a critical process of preparing their systems, faculty, and course structure [...]
Retention Is a Team Sport: Why Shared Visibility Matters
Resolution: Retention Retention Is a Team Sport: Why Shared Visibility Matters Retention isn’t one office’s job. It isn’t one program. One email. One cam [...]
Using Measurable Objectives to Get the Most From Corporate Trainings
After you’ve delivered training, you may wonder what your company is getting out of it. If you’ve created measurable objectives, you'll know!


