How can you make sure you’re honing in on data that’s actionable for you and your students *now*? Perusing the ever-increasing mountain of data available to us might be interesting, but data for data’s sake isn’t helpful.
Enter Learning Analytics.
Learning Analytics collects and analyzes data produced by learners during their interactions with online and offline learning environments and combines descriptive, diagnostic, and prescriptive analytics with the very human skills of instructional design, learner-centered advocacy, and communication.
One compelling aspect of Learning Analytics is its applications to students in real-time. Good Learning Analytics metrics and practices are strategically and purposefully selected ahead of time so that you collect the *right* data and know what to do with it once you have it.
Alyssa Wise, Professor of Learning Sciences & Educational Technology at NYU’s Steinhardt School suggests approaching Learning Analytics through the lens of the “5 P’s:
- Point
- Process
- Proxy
- Plan
- Payoff
Here’s an excellent video presentation from Dr. Wise which elaborates on the 5 P’s.
To illustrate, let’s say you are the proud instructor of Widgets 101 wherein the goal (point) of the endeavor is for students to come away with a basic understanding of widgets.
What process are you utilizing to create this understanding? You might construct a series of modules that introduce students to the material through a short video lecture, then further solidify their newly acquired knowledge by engaging in a simulated widget building project. Additionally, you check learner understanding of the material by having students take periodic formative assessments.
You can then assign data points as proxies for each of the segments of the process. How long a learner was in each of the portions of the course mentioned above might be a proxy for student engagement. Comments and interactions around the widget building project might be a proxy for learners’ critical thought processes. Quiz results might be a proxy for level of understanding and retention.
Your plan might be to check in on these metrics daily. If you notice that a few students have not watched the lecture, had trouble with the simulation, or failed the quiz, you’ll reflect on your pedagogy and reach out to learners with supports targeted at the particular areas of the process where they’re struggling.
What is the payoff to all this? Not only do you get good diagnostic and descriptive data to improve future iterations of your course, but you can intervene and course-correct as you go to make sure your current crop of students become Masters of the Widget.
By combining technology with instructional design and learner-centered interventions, Learning Analytics allows educators to think critically about and drill down on the data that is genuinely relevant and actionable to help learners succeed in real-time. Data is a powerful tool, but only if you turn that tool towards a clearly defined learner-centered purpose.
Are you facing a challenge around efficiently getting actionable data and reports from your LMS? Schedule a chat with us, take advantage of our webinars. We’d love to help you harness the power of Learning Analytics.

Elizabeth Dalton measures and improves educational tools, processes, and results by using her experience in instruction and assessment design, development, documentation, and delivery, combined with her knowledge and expertise in technology and statistical methods.
Resources
Explore Learning Analytics Insights
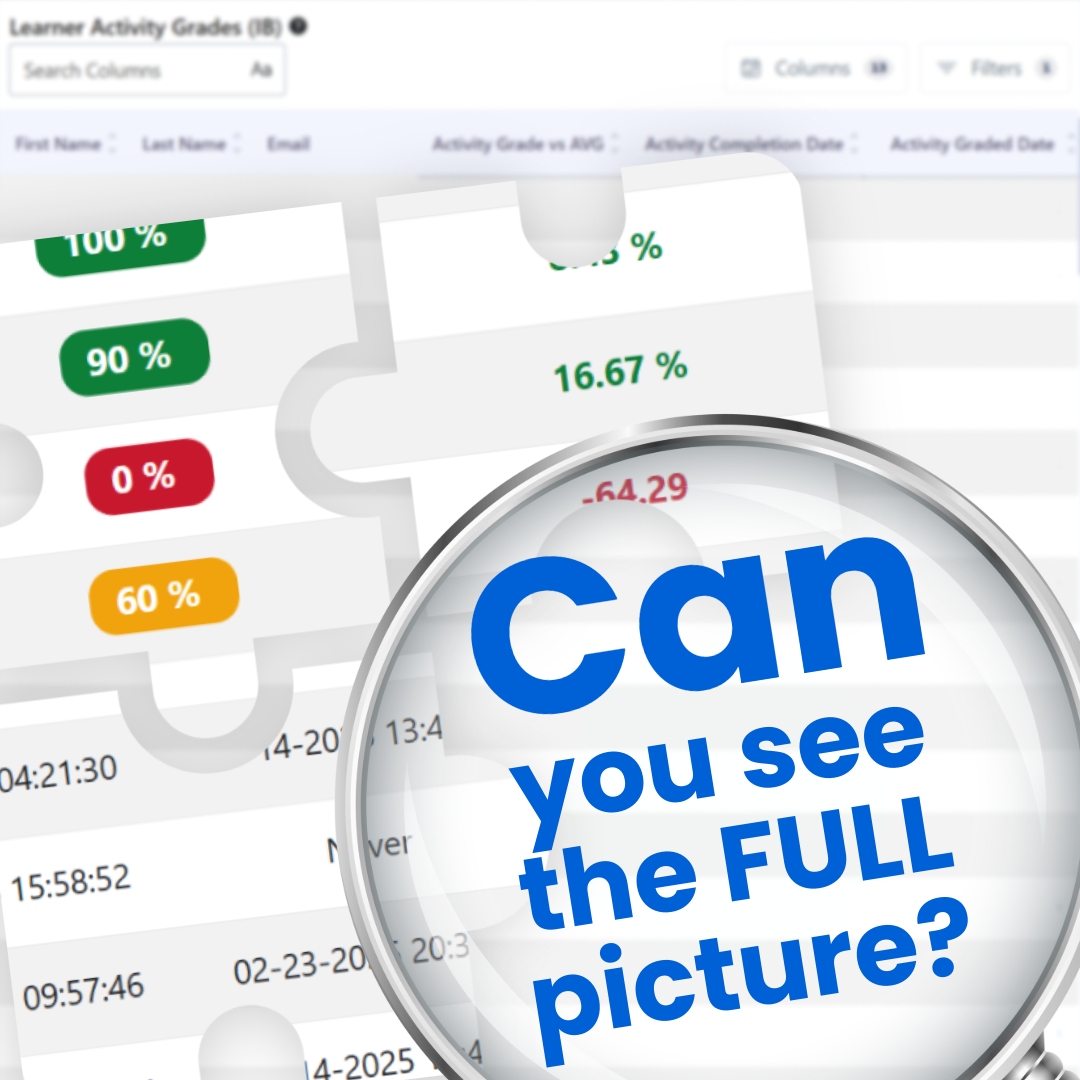
Your LMS Shows Activity, Not Insight: Why LMS Analytics Fall Short
Can You See the Full Picture? Your LMS Shows Activity, Not Insight: Why LMS Analytics Fall Short Native LMS analytics have become a standard tool in high [...]

LAK 24: Report from Kyoto
LAK 24: Report from Kyoto
The Cost of Waiting: When Retention Data Comes Too Late
The Cost of Waiting: When Retention Data Comes Too Late In higher education, retention is often treated like a midterm problem. Midterm grades are review [...]