
There is a growing demand for learning institutions and organizations with large learning components to better leverage the ubiquitous data that comes from the technology systems powering modern learning. In their 2024 Trend Watch report, EDUCAUSE states that “students, faculty, and others are asking how data is being used to inform decisions. Institutions are now focused on getting data into a usable format and into the hands of those who need it for decision-making. To break down decentralized and siloed data systems…”
Getting data into a “usable format” into the “hands of those who need it” is a priority. Historically, traditional business intelligence (BI) tools have been unable to fit the bill in the education space; bottom line: they are not built for education and are extremely difficult to scale.
The institutional data that needs to be extracted and analyzed resides primarily within a Learning Management System (LMS) like Canva or Moodle, with demographic data (dates, grades, financial info) stored in a Student Information System (SIS). Collectively, this is the good stuff, the data needed to provide insight into students and their learning environments. While there have been recent improvements in some native LMS analytics packages, most are limited in scope, making a learning analytics platform like IntelliBoard essential for extracting actionable insights.
Consider these three ways that you can better leverage your LMS data to the fullest:
1. Address Retention Risks
Addressing retention risks in higher education isn’t new and it’s not going away. It’s crucial because it affects an institution’s bottom line and, equally as important, impacts a student’s future. The key is knowing ASAP who might be at risk and implementing early intervention tactics. If you wait until midterm grades are posted to see who is struggling, it’s often already too late.
Institutions must pull crucial data from their LMS to create reports that immediately address retention risks. By first defining what “at risk” means (a definition that will vary across departments and institutions), New Mexico State University Global Campus (NMSU Global) was able to create a report that flags Inactive Users—students who have not accessed one of their courses (either course material or activity) in the past 7 days.
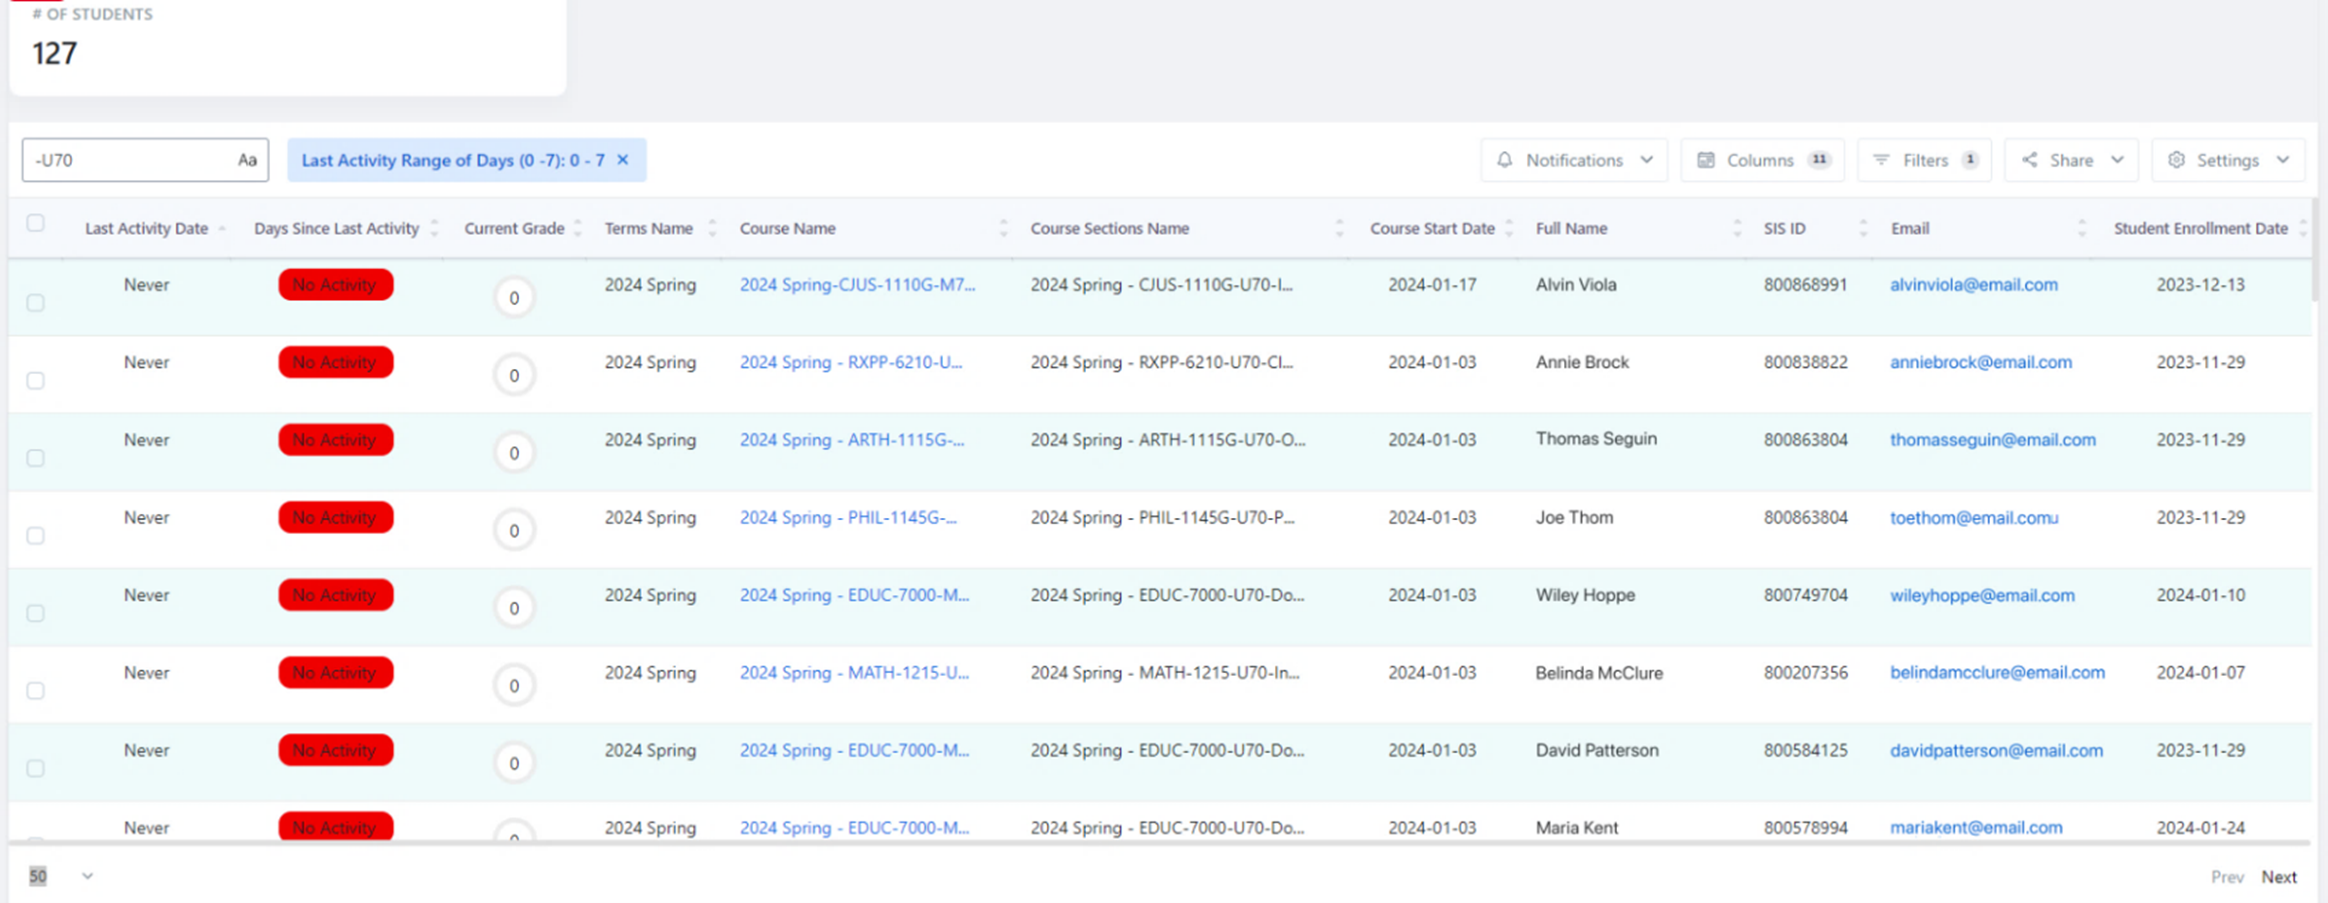
Figure 1: In the Inactive User report, the column in red highlights "No Activity" registered for students within a specific term across all classes.
With the report in hand, academic advisors/student mentors reach out to each learner with reminders that there is activity required and can also ascertain if additional intervention is required.
NMSU Global paired the Inactivity Report with an At-Risk Learner report based on the institution’s “2.10.60” requirement. They defined their at-risk criteria in this category as two (2) or fewer logins on an activity; less than 10 minutes time spend on an activity; or a grade of less than 60. Meeting any of these criteria will add a student to the At-Risk report and kick off NMSU Global staff intervention.
Combined in one dashboard, these two reports are having a significant impact at NMSU Global. In one 2-week period, the school gained 204 students back into engagement, a phenomenal result.
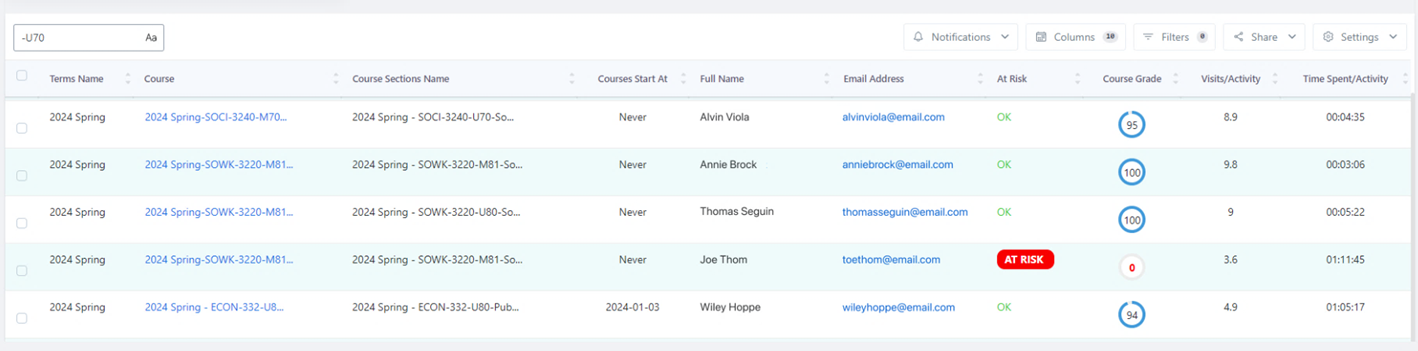
Figure 2: At risk students are clearly visible via red bullet.
2. Expand Insights Through Integration
A late 2022 study by researchers at UCLA and MIT Press found that universities lag behind industry, business, and government in capturing and utilizing data. In a follow-up interview with Government Technology, study co-author Christine Borgman of the UCLA School of Education and Information Studies explained that despite the adoption of learning management systems and systems for registrars, libraries, faculty, and more, institutions are “often buying them as silos that don’t interoperate with each other.”
This decentralization has led to constrained data sharing and hindered operational efficiency. “Universities are missing tremendous opportunities to leverage their own data for decision-making, collaboration, and greater autonomy from commercial platforms,” said Borgman.
Leveraging the combined data of integrated systems to make informed decisions has been adopted by Florida’s Tallahassee Community College (TCC). The data from their Canvas LMS is given clarity and guidance through integrations with their Workday SIS, Mongoose Cadence messaging, and Qwickly attendance platforms. Although there are countless reports that can be created from this depth of data, TCC specifically needed an Academic Success report for deans that identified and tracked progress for dual enrollment students (students taking classes to satisfy high school requirements and earn college credits).
IntelliBoard was able to combine LMS, SIS, and attendance data into one dashboard that gave academic deans a quick view of the academic period, course delivery mode, scholarship info, course grade, attendance, activity engagement, time spent on activities, and more…presenting a complete picture of the student’s activity. All of this in one report enabled academic deans to quickly identify areas where students might struggle and need intervention.
This type of data can be customized and shared with groups who may not have access to LMS data. Athletic advisors, for instance, can quickly ascertain which student athletes may need additional academic support and provide intervention before their eligibility status is at risk.
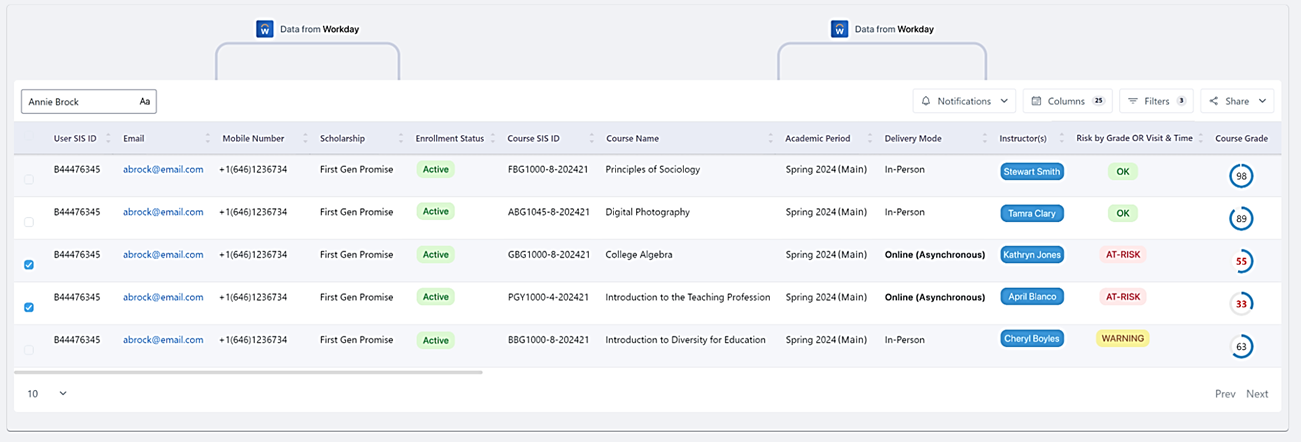
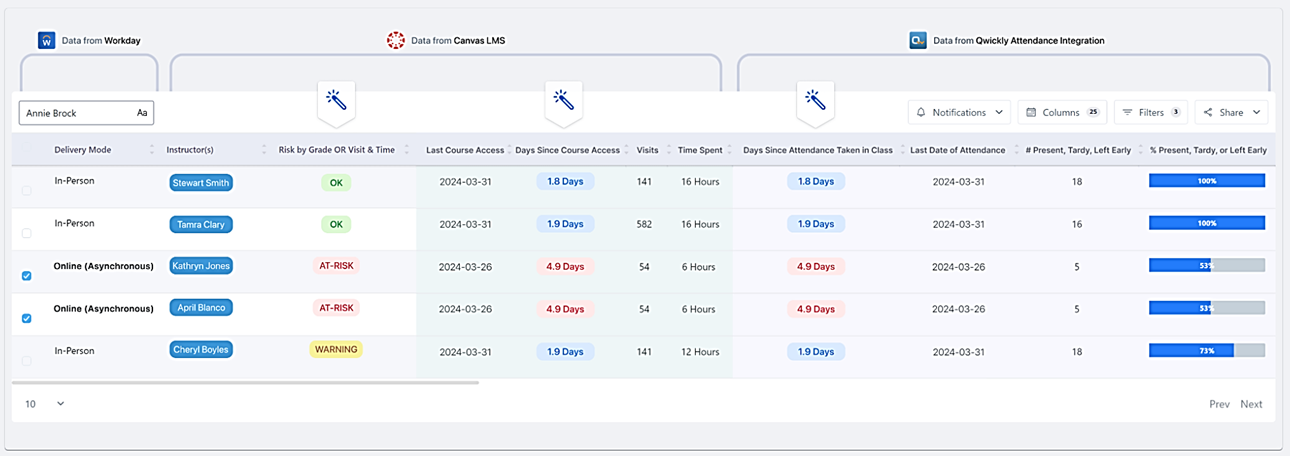
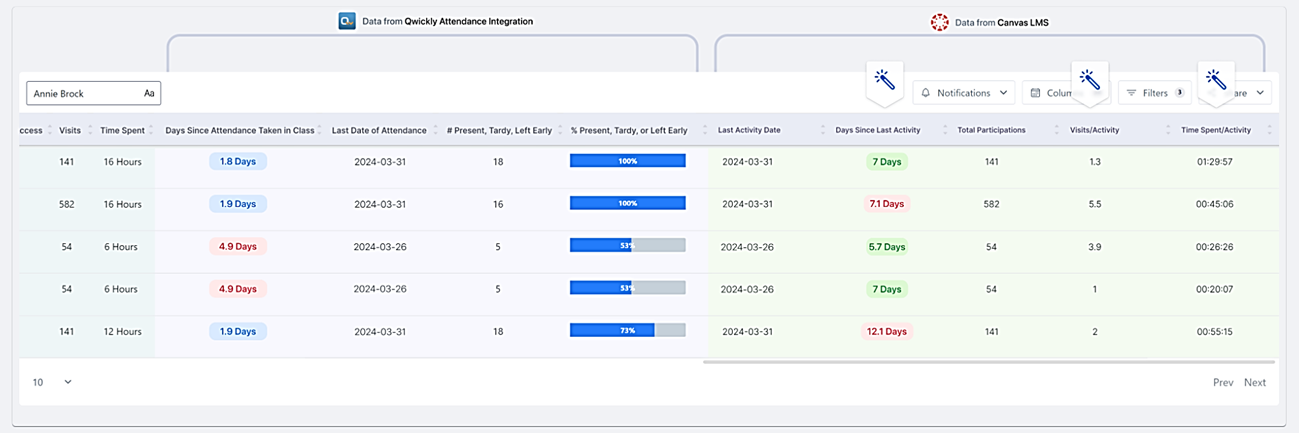
Figure 3: Each screen is part of the same dashboard, showing the breadth of data imported from three different platforms.
3. Streamline DOE Census Data Reporting
The Pell Recalculation Date, also known as census data, is when an institution’s Financial Aid Office evaluates a student’s eligibility for a Pell Grant based on their current enrollment status. Schools must confirm each student’s enrollment and participation in each class. Delivery of this data to the Department of Education (DOE) is mandatory for students to receive federal financial aid.
The collection of this high-stakes data is often a very manual, headache-inducing process at many institutions, driven primarily by attendance rosters, attestation forms, and activity completion spreadsheets—despite attendance and/or activity data being available within an LMS.
IntelliBoard worked with the North Carolina Community College System (NCCCS) on a methodology and solution for streamlining the collection process via a dashboard pulling data from both the LMS and SIS. (This dashboard has been utilized at many schools since, including the majority of the North Carolina Community College System.) As an example, at one school within the system, Guilford Technical Community College (GTCC), the First Submission Monitoring Dashboard was deployed to 650 instructors via Canvas LTI as well as to registrars without access to the LMS via an IntelliBoard login. Each instructor sees only their students and their classes while, for auditing purposes, registrars have access to all learners.
The dashboard shows which students have completed their first activity (assignment, form, discussion, quiz, etc.) and those who have yet to do so. The implication for student failure to submit, at minimum, is being dropped from the course. Would that drop them down below full-time, thus eliminating their ability to receive Pell Grants? Does it impact athletic eligibility?
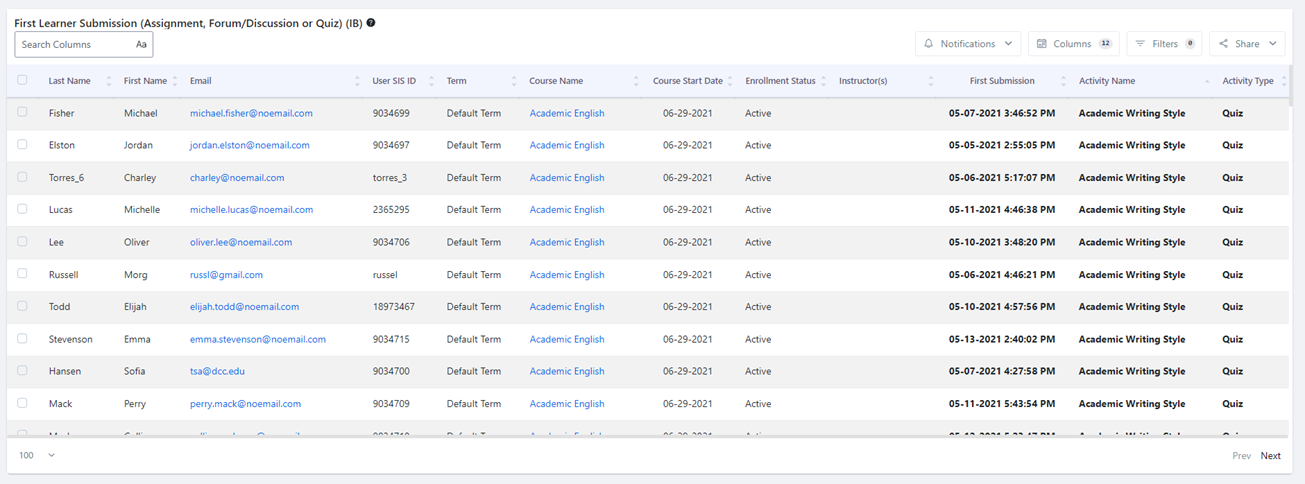
Figure 4: Instructors can see who has submitted an activity, what type of activity, and for which course.
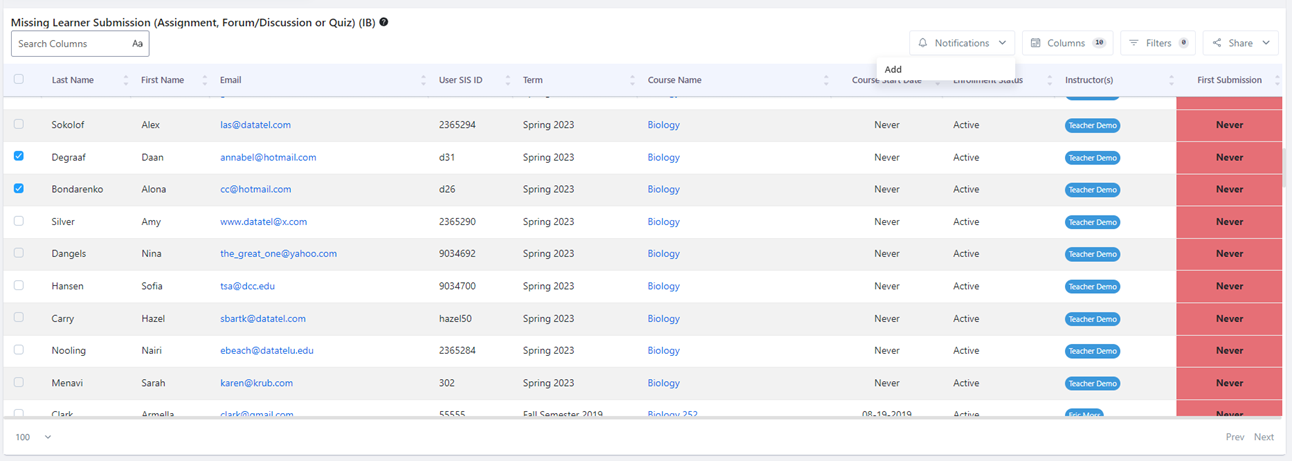
Figure 5: Students who have not yet submitted an activity are flagged and clearly visible.
For students who have not yet submitted, instructors can click next to their record on the report and send a quick notification detailing which course activity is needed before a specific date. Reports can be scheduled to go out automatically.
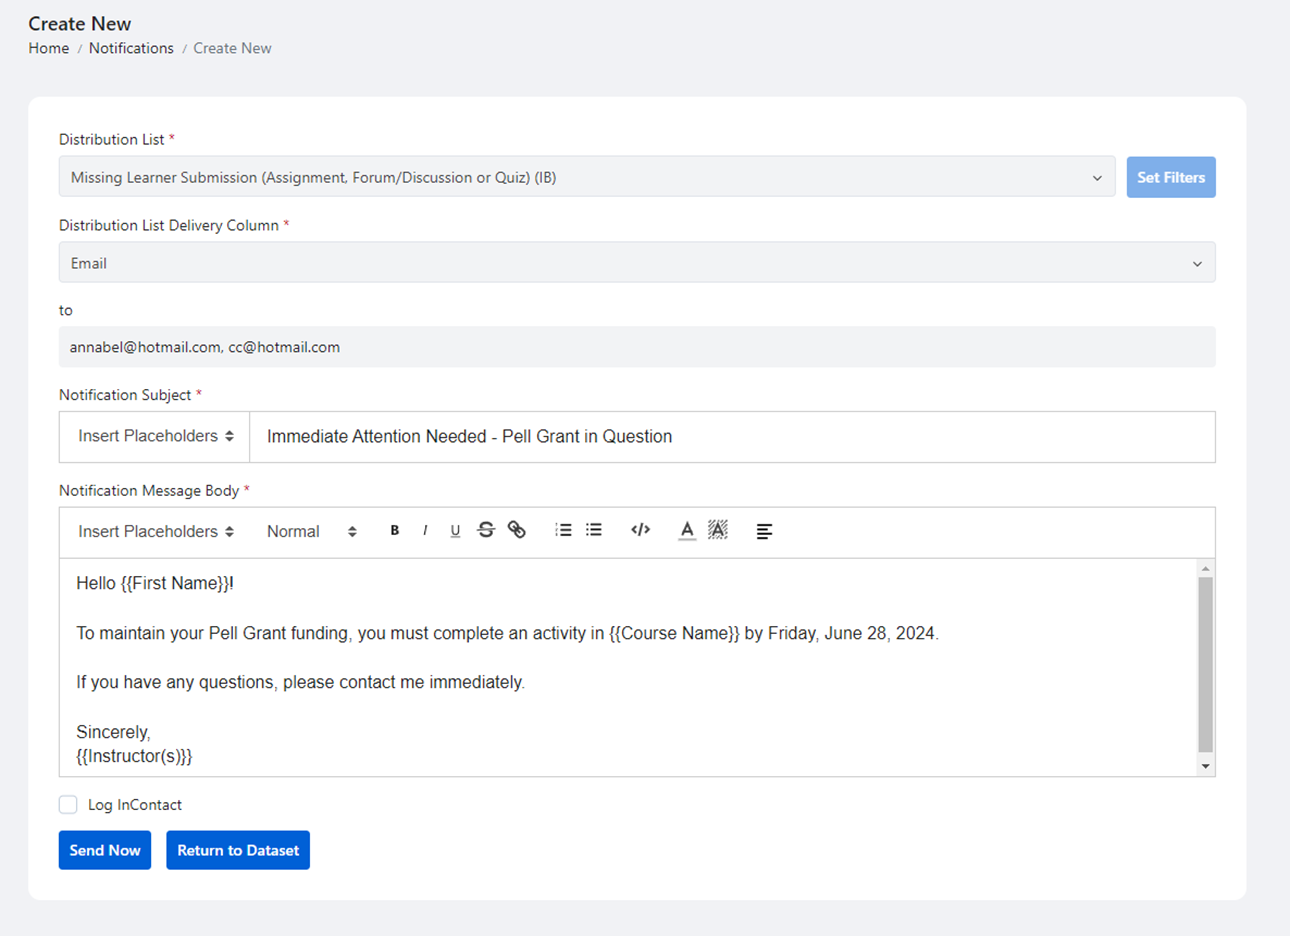
Figure 6: Student notifications can be sent directly from the report to remind students of the imperative.
The use of this dashboard and the simplicity with which schools can submit their enrollment data greatly streamline the reporting process and save institutions countless hours of manual work. Schools can be assured of the accuracy of the data they’re submitting and in the financial aid they will receive.
Conclusion
Leveraging learning analytics to supercharge your LMS data can enhance student retention, expand insights through integration, and streamline essential data reporting processes. The examples shared of NMSU Global, Tallahassee Community College, and the NCCC system illustrate the significant impact that well-utilized LMS data can have on student success and institutional efficiency.
Want to learn more? Schedule a 30-minute call with a Learning Analytics Expert

Elizabeth Dalton measures and improves educational tools, processes, and results by using her experience in instruction and assessment design, development, documentation, and delivery, combined with her knowledge and expertise in technology and statistical methods.
Resources
Explore Learning Analytics Insights

Customize Your Institution’s Definition of Student Retention
Learn what student retention means in a practical sense and how data-driven solutions help to achieve meaningful student retention rates.

IntelliBoard dentro del Plantel: Uniendo Su Ecosistema de Éxito Estudiantil
En este blog hablamos sobre cómo los instructores pueden usar IntelliBoard para mejorar sus cursos universitarios. Pero, ¿qué pasa con el panorama general [...]

How Universities Can Break Down Data Silos and Generate New Insights
Break Down Data Silos and Generate New Insights